The Eastward Pivot: Straits of Hormuz Oil Flows Toward Asia as Europe Falls Behind
- Team WAKE

- Mar 4
- 6 min read
AIS vessel tracking data from the Strait of Hormuz reveals a 5-to-1 ratio of tankers heading East versus West — and the crisis is only making it worse.
Worldwide AIS Data Intellegance Team. March 4th 2026
KEY FINDINGS 1,471 unique vessels detected across WWAN stations over 7 days — but daily traffic collapsed from ~138 ships/day (January average) to just 21 on March 4, a 85% drop. 5:1 East-to-West ratio — 71 tankers heading to Asia vs. only 14 to Europe. This mirrors the EIA's 2024 baseline of 84% Asia-bound crude, confirming the structural eastward tilt holds even during a crisis. ~$10 billion in estimated crude oil value in transit during the data window - against a normal weekly throughput of ~$9.6B. But daily flows cratered from ~$1.4B/day to ~$210M on March 1 as tankers stopped moving. 40 tankers “For Orders” — idling and waiting for charter assignment or price signals VLCC day rates surged from $218K to a record $424K/day (+94%). Brent crude jumped from $68 to $81.40 (+19.7%). War risk insurance — previously 0.125% of hull value per transit — has been cancelled entirely by major P&I clubs. |

On February 28, 2026, US and Israeli forces struck Iran. Within hours, the Islamic Revolutionary Guard Corps issued radio warnings across VHF Channel 16: no vessels would be permitted through the Strait of Hormuz. By March 2, traffic through the world’s most critical oil chokepoint had effectively stopped. Insurers pulled war risk cover. Maersk, Hapag-Lloyd, CMA CGM, and MSC suspended operations. Oil spiked above $81 a barrel.
But the data tells a story that started before the first missile was fired. Over the seven days captured in our network’s AIS records — from February 25 through March 4 — Worldwide AIS Network tracked 104,523 AIS transmissions from 1,471 unique vessels across three decentralized receiver stations positioned on either side of the strait and in Qatar. The picture that emerges is not just one of crisis. It’s one of structural reorientation: Gulf oil is heading East, and Europe is being left behind.
The Raw Numbers: What 1,471 Vessels Tell Us
Of the 1,471 vessels detected, 549 were tankers — 37% of all traffic. Another 435 were cargo ships, with the remainder comprising tugs, service vessels, passenger ships, and others. Among the tankers, 134 were VLCCs (Very Large Crude Carriers), the supertankers measuring over 300 meters in length capable of hauling approximately 2 million barrels of crude each. A further 63 Suezmax and 106 Aframax tankers rounded out a fleet representing hundreds of millions of barrels in combined capacity.
We also identified 88 LNG carriers, many of them Qatar’s giant Q-Max and Q-Flex vessels operating between Ras Laffan and destinations across Asia and Europe. The LNG angle is particularly significant: Iranian drone strikes forced QatarEnergy to halt production at Ras Laffan and Mesaieed, effectively taking one-fifth of global LNG export capacity offline in a single geopolitical event.
Five to One: The Eastward Pivot of Strait of Hormuz Oil Traffic
The most striking finding in our data is the destination split. Of all tankers with identifiable long-haul destinations, 71 were heading East to Asia and only 14 were heading West toward Europe. That’s a 5-to-1 ratio.
Destination | Tankers | VLCCs | Laden | Share |
India | 22 | 5 | 4 | 25.9% |
China | 21 | 12 | 12 | 24.7% |
Singapore / SE Asia | 17 | 8 | 8 | 20.0% |
Europe (all routes) | 14 | 3 | 5 | 16.5% |
Japan | 6 | 5 | 6 | 7.1% |
South Korea | 5 | 4 | 4 | 5.9% |
Table: Tanker destinations from WWAIS AIS data, Feb 25–Mar 4, 2026. “Laden” indicates vessels with draught exceeding 12m.
China alone accounted for 21 tankers, 12 of which were VLCCs sitting deep in the water at draughts exceeding 20 meters, fully loaded with approximately 2 million barrels each. Vessels like the VESUVIO (333m, 21.4m draught, heading to Zhoushan), the UNIVERSAL CREATOR (336m, 21.2m draught, bound for Ningbo), and the XIN YONG YANG (333m, heading to Jieyang) represent the physical reality of China’s energy dependence on Gulf crude.

India registered 22 tankers, though fewer were laden VLCCs — consistent with recent reporting that India is scaling back Gulf imports under pressure from US trade conditions linked to reducing Russian crude purchases. The DESH VAIBHAV, DESH VIRAAT, and DESH VISHAL — three Indian-flagged VLCCs all sitting at 21m draught — were heading to Vadinar, Mumbai, and Visakhapatnam respectively, carrying what is likely some of the last crude loaded before the strait’s effective closure.
Europe, by contrast, was barely visible. Just 14 tankers had European or Suez-bound destinations, and only a handful were laden. This aligns with J.P. Morgan’s recent analysis noting that sanctions on Russian crude are reshaping global trade flows, with barrels being redirected away from India and primarily toward China. Europe, which has spent two years pivoting away from Russian energy, is now finding Gulf supplies increasingly contested by Asian buyers willing to pay premium freight rates.
The Energy Price Dimension
The timing of our data window is extraordinary. WTI crude sat at roughly $64 a barrel in early February. By March 3 — the last full day in our dataset — it had hit $74.56, with Brent surging to $81.40. Intraday peaks touched $82. VLCC charter rates from the Gulf to China hit an all-time record of $423,736 per day, a 94% increase in 48 hours.
Our data captured this in vessel behaviour. Daily unique vessel counts tell the story vividly: 328 vessels on February 25, a spike to 813 on February 28 (the day of the strikes, as vessels rushed to transit), then a sharp decline — 527 on March 1, 327 on March 2, 167 on March 3, and just 21 detected on March 4 as the strait became effectively closed.
Forty tankers in our dataset were listed as “For Orders” — industry terminology for vessels idling without a charter, waiting for price signals. This is a leading indicator of market uncertainty that commodity traders watch closely.
Flags, Dark Fleet, and Iranian Vessels
The flag state composition of Hormuz traffic is itself a story. Over 56% of all vessels fly flags of convenience — Panama (209), Marshall Islands (162), and Liberia (154) dominate. This is structurally significant: in a crisis, vessels under open registries are harder to hold accountable and more difficult for any single nation to sanction or control.
We detected 31 Iran-flagged vessels in the dataset, a figure that carries particular weight given the current hostilities. These included the RADIN, a 366-meter cargo ship (one of the largest in the dataset), and the HILDA 1, a VLCC sitting at 20.3m draught and listed “For Orders.” The Iranian cargo ship BASHT listed her destination simply as “HIGH SEA” — a common indicator of sanctions evasion or dark fleet activity. Several other Iranian vessels were heading to Chinese ports, underscoring the Iran-China crude pipeline that continues to operate despite Western sanctions.
What This Means for Markets
The 5-to-1 East/West tanker ratio is not a temporary blip caused by the crisis — it reflects a structural shift that was already underway. China’s refineries, particularly independent “teapot” processors, have been absorbing ever-larger volumes of Gulf, Russian, and Iranian crude. India, while scaling back under US pressure, remains a major buyer. Japan and South Korea continue their long-standing dependence on Gulf supplies.
Europe, meanwhile, faces a compounding problem. Having pivoted away from Russian pipeline gas and crude since 2022, the continent is now discovering that its alternative Gulf supplies are being outbid by Asian buyers. The closure of the Strait of Hormuz — even temporarily — hits Europe disproportionately hard because it has fewer alternative supply routes and less strategic petroleum reserve depth than its Asian competitors.
Wall Street has taken notice. Goldman Sachs has warned that a prolonged Hormuz closure could send crude above $100 a barrel. Analysts at J.P. Morgan forecast Brent averaging $60 for 2026 under normal conditions but acknowledge that geopolitical risk is the “wild card.” With VLCC rates at all-time highs, insurance providers pulling war risk cover, and the strait physically contested, the market is pricing in a scenario that our AIS data shows was already structurally tilted before the first shot was fired.
Methodology

This analysis is based on static AIS (Automatic Identification System) reports — message types 5 and 24 — collected by three ground-based receiver stations in the Worldwide AIS Network, a blockchain-verified decentralized maritime data network. The dataset comprises 104,523 AIS messages from 1,471 unique vessels identified by MMSI, covering the period February 25 to March 4, 2026. Vessel classifications are derived from IMO ship type codes, flag states from Maritime Identification Digit (MID) prefixes, and size estimates from reported AIS dimensions. Tanker capacity estimates use standard industry approximations based on vessel length overall. Destination analysis uses self-reported AIS destination fields, which are manually entered by vessel crews and may contain variations or inaccuracies. All data was collected and verified through WWAIS decentralized station network.
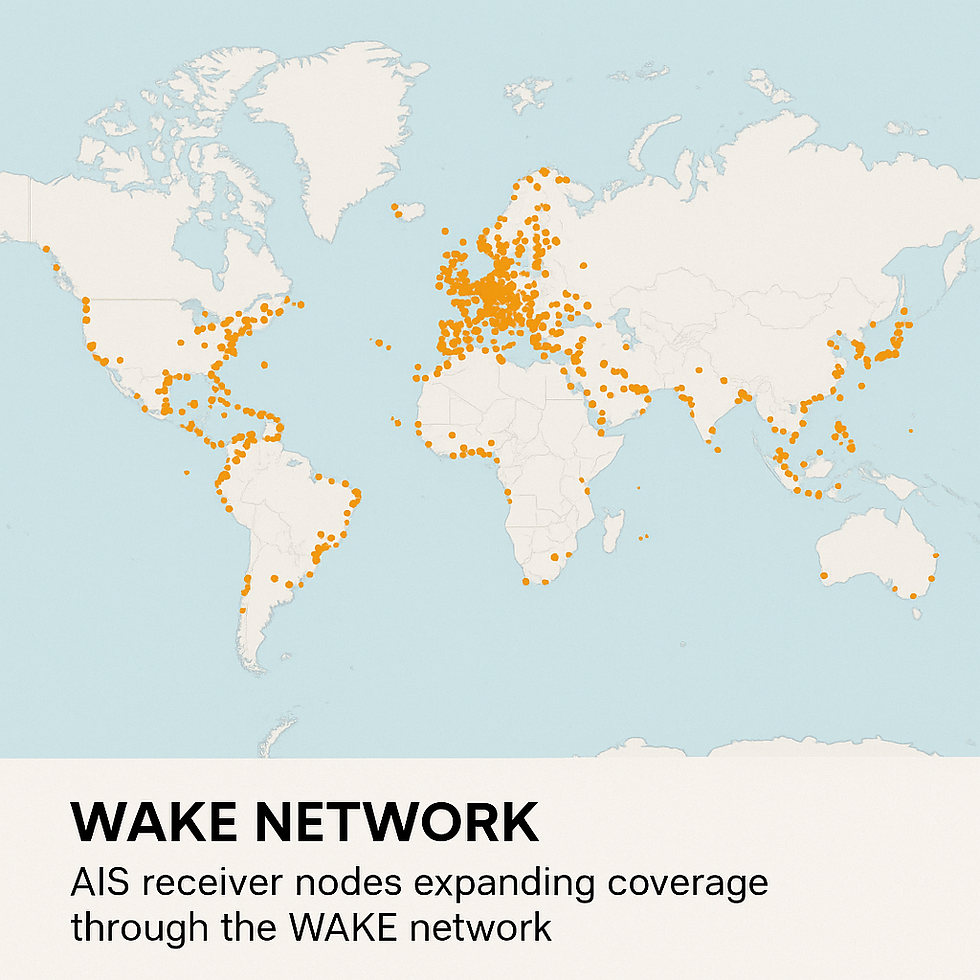
About Worldwide AIS Nework The Worldwide AIS Network (WWAIS) is a decentralized maritime data platform providing blockchain-verified vessel tracking intelligence. Unlike consolidated data providers, WWAIS’s distributed station network delivers transparent, tamper-proof AIS data to maritime intelligence companies, commodity traders, and defense agencies. For access to our real-time data feeds and API, visit worldwideais.org |


Comments